National Radar Network - SSI (eng)
Da Mydewiki.
| Layer name | Radar National Network - SSI | |
| Tag | Storms | |
| Folder | / Layers / observation / radar | |
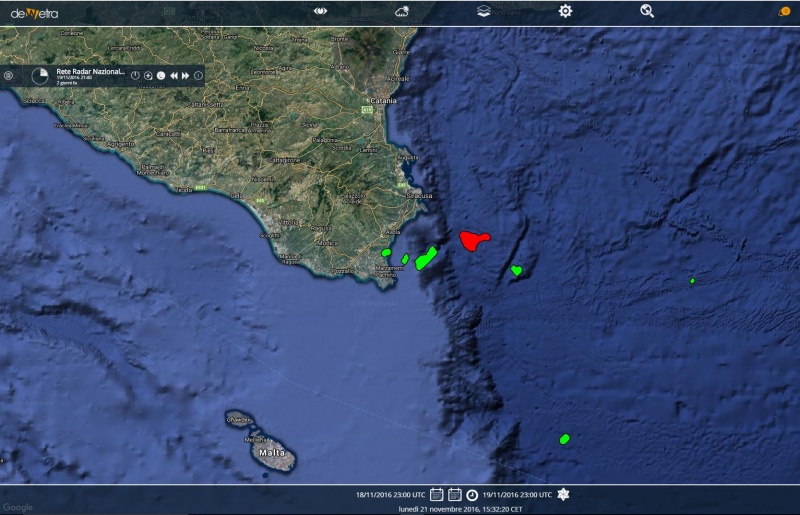
| Description | The SSI variable is the radar-detected storm severity index computed useing the data supplied by the composite of the Italian National Radar Network. The data measured by the weather radars composing the national radar network are processed and mosaicked at DPC-CFC. The image displayed by default is the last available image processed by the system. The SSI maps are updated every 10 minutes and users can load each map within the time range. SSI is computed through an identification algorithm input and tracking of storm cells (Handwerker, 2002). To define a convection cell, firstly all the points of the mosaic with reflectivity values exceeding 45 dBZ have been identified. All the grid points exceeding 35dBZ and contiguous to the maximum are associated with it: the adjacent areas consist of at least 5 grid points on the mosaic domain (approximately 3 km2 to current resolution) are considered valid. For each storm the algorithm defines a centroid, while the shape of the thunderstorm cell is approximated to an ellipsis within the 98% confidence interval (Press, 2007). Once the active cells are located, the algorithm computes the area, the average reflectivity and maximum speed, the height of the cloud top, the Vertical Integrated Liquid (VIL, as in Doviak and Zrnic, 1984), and the probability of hail (Holleman, 2001) associated to the cell. As a result, the SSI of the MCS is computed through the sampling function, ranging from 1 (weak) to 5 (severe), corresponding to 50th, 70th, 85th and 97th percentile of the distribution. | |
| Screenshot | ||
| Properties | ||
| Available variables | Storm severity classification | |
| Available accumulations | ||
| Available interpolation algorithms | ||
| Available filters | ||
| Spatial aggregations |

