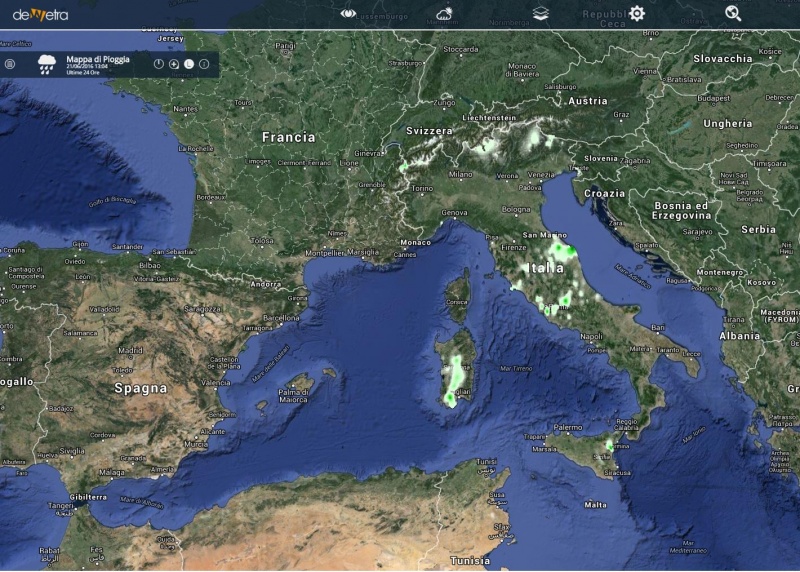
Rainfall Map (eng)
Da Mydewiki.
Versione del 21 nov 2016 alle 12:18 di Mydewetra (Discussione | contributi) (Creata pagina con " [Home] - [Observations] <br/> {| class="wikitable" |- |style="background-color: orange;" |Layer name |style="background-color:...")
| Layer name | Rainfall Map | |
| Tag | Rain | |
| Folder | / Layers / observation / stations / maps | |
| Description | Tool for the visualization of the interpolated raingauges recorded by all the italian stations. Data are interpolated by means of two selectable algorithms: GRISO and the inverse squared distance. GRISO is an interpolation algorithm, implemented by CIMA Foundation for the processing of data by rainfall sensors. Users can display the accumulated precipitation of different time spans ranging from 1 to 24 hours. The ranfall mpa can also be averaged at basin, warning area, municipal, provincial, and regional scale. | |
| Screenshot | ||
| Properties | ||
| Available variables | Rainfall | |
| Available accumulations | 1, 3, 6, 12, 24 hours + time range | |
| Available interpolation algorithms | GRISO, inverse squared distance | |
| Available filters | Any threshold between 10 and 500mm | |
| Spatial aggregations | Municipalities, Provinces, Regions, Meteoclimatic Vigilance Areas, Warning Areas, Catchments |

